I’m just halfway stepping through this video so far (26 minutes total). It seems like a pretty genius explanation, but maybe that is only relative to other explanations I have seen that are so bad. Any way, it might be of interest to someone else here.
Just clarifying to myself:
@ 7:53
"If you want to know how much of a particular sine wave is in a signal, just multiply the signal by the sine wave at each point. Then add up the areas under the curve."
This only works if the sine is in phase with the signal. If the sine of a given frequency is a component of the signal and it is fully out of phase, when multiplying, the sine will cancel itself from the signal, falsely indicating that it is not present in the signal. If the sine of a given frequency is a component of the signal and is partially out of phase with the signal, when multiplying, the sum of the positive half cycle and negative half cycle can be either negative or positive depending on the phase relationship, which if negative could falsely indicate that the sine is not present in the signal.
If you ask me, skipping over this point is a big oversight for explaining the concept of the fourier transform.
Official video link:
(mod edit: changed to Veritasium official Odysee channel video)
1 Like
It’s been way too long since I’ve had to look at the calculations behind any of this, but there is something about your statement about being in phase, and negative values, that makes me feel uncomfortable.
But it’s been way too long since I looked at any of this.
By the way, Geogebra is a pretty nifty tool for graphing so that you can play around with sine functions and such for yourself as you watch the video.
You might enter these functions for example:
f(x) = sin(x)
g(x) = sin(x + p)
h(x) = f(x) * g(x)
‘p’ gives you a slider for phase of ‘g’ so that you can see how ‘h’ is changed by the phase relationship of ‘f’ and ‘g’.
I would be interested in seeing any problem in my post about phase. It is highly possible that I’m wrong. I have zero training in math for engineering.
Again, been way too long, but my brain is telling me that no two differing frequencies are ever in phase.
Or something.
Even if they could be instantaneously, a discrete point has no frequency.
Or something.
Gawd I wish I’d studied harder.
We’re talking about the same frequency for a component of a signal and a sine, as in finding whether a given sine frequency is a component of a complex signal. See the geogebra post above. If any clarification is needed for my post, just mention it.
I’ll have another look at this when I’m less tired.
So so long since I even looked at DSP programming.
Since drumphill is tired and might post about this later,  , I’ll point out the problem in my problem post. Just a minute later @ 9:34 in the video, it is pointed out that it is necessary to multiply the signal by a sine, multiply the signal by a cosine, and the ratio of the two products indicates the phase of the signal.
Now that sounds reasonable. Having the phase of the signal, it can be used to align the signal and the sine. I need to tinker with it in a plotter to make it absolutely clear.
I first started thinking about this sort of stuff when I got my first sound card that actually had some hardware DSP capabilities. A Sound Blaster AWE-32.
One of the things it could do in it’s synth section was alter the pitch of samples without changing their duration. I looked into it, and came away with a rough idea of the concept of looking at sound as a spectrum of frequencies, sine waves, and that treating the signal that way allows you to shift the range up or down without changing the duration.
Then I discovered MP3’s. I heard about frequency bins, and that made we wonder, how many do you need to represent a waveform without losing any information (ignoring lossy compression stuff, that’s another subject all together).
I think these two articles are the most useful I’ve seen as a relatively quick overview. I don’t pretend to have a complete understanding of this stuff, but they definitely helped.
http://blogs.zynaptiq.com/bernsee/pitch-shifting-using-the-ft/
Checking the first link out now.
I remember mentioning on the old forum being surprised after sending a square wave out of my sound card and back in (for measuring latency) and seeing the squiggly square peaks and valleys, not knowing at the time that a square wave is composed of a bunch of sines and that the filter at the dac was rolling the higher frequencies off, making the peaks and valleys of the remaining frequencies visible.
Did you understand what was presented in the first link? It falls apart early in for me at this point:
Bolded for emphasis.
Also, this point earlier on isn’t clear when considering other points of the article:
But an earlier caption says:

And then we see this a little further in:
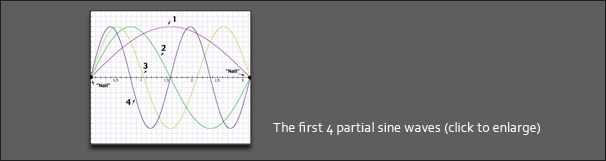
…which shows a half cycle being used to represent the lowest frequency. And the article iterates that point. But it just said that a single point doesn’t tell us anything about the frequency of a sine.
Seems very muddled to me.